Depth contours
Fish live on edges. A one foot change in a flat, the lip of a channel, the shoulder of a hole. If your map stops at the shoreline you are fishing the top two percent of the water column blind.

Six bands and a contour set, straight from the survey
Cobia renders bathymetry as six depth bands from near shore shallows down past a hundred and twenty feet, with contour lines stepped by depth so the shape of the bottom reads at a glance.
- NOAA BlueTopo high resolution bathymetry where it exists
- NOAA CRM coastal relief filling the gaps between BlueTopo tiles
- Six bands from zero to five feet through a hundred and twenty plus
- Contour lines stepped by depth so edges read like a topo map
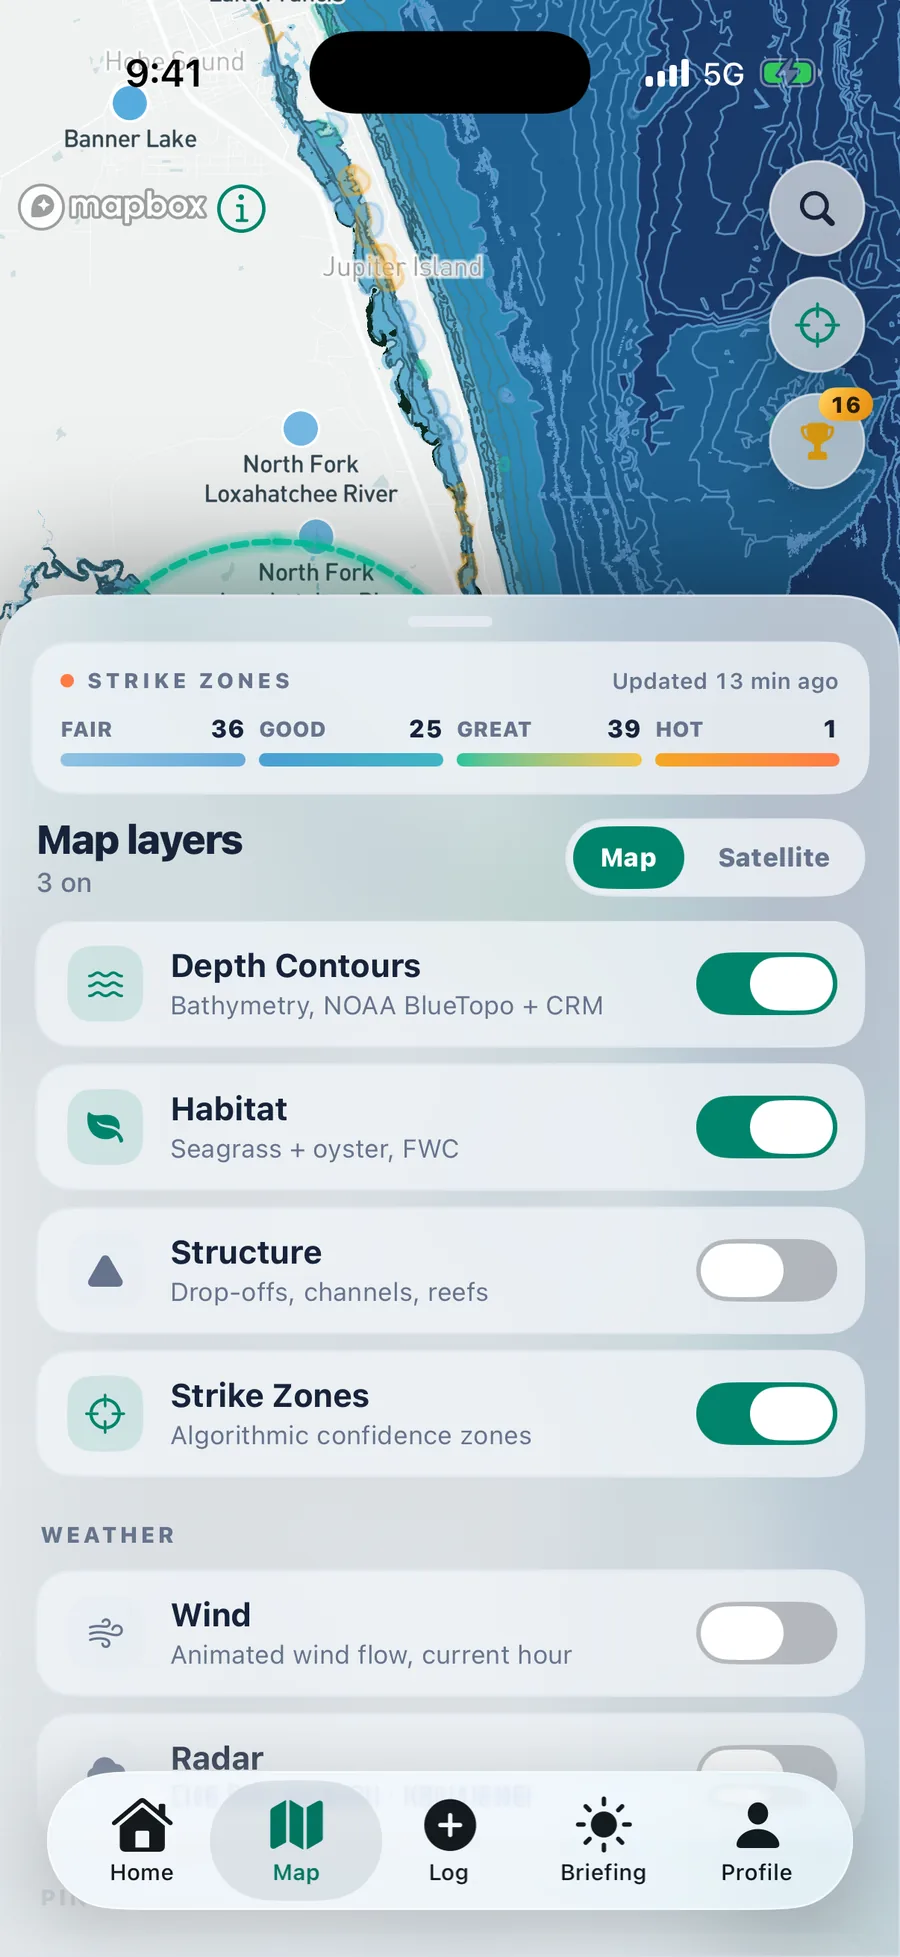
What the bottom tells you before you cast
Find the edge
The transition from three feet to nine feet is where a redfish sits waiting on a falling tide. On the map it is a band boundary you can see from the truck.
Channel and cut
Channel edges concentrate current and bait. Contours make the channel obvious even when the surface gives nothing away.
Holes and humps
A hole in a flat holds fish in cold water. A hump in open water holds them in summer. Both show as closed contours you can navigate to.
Plan the draft
A skiff drafting fourteen inches goes where a bay boat cannot. Knowing the shallow band before you commit saves lower units.
Stack with habitat
Turn on habitat at the same time and find where a grass edge meets a depth change. That intersection is the highest value real estate in inshore fishing.
Coverage varies
Bathymetric coverage follows survey coverage. It is deepest on the coast and in charted inland systems. Where it thins out the layer says so rather than inventing bottom.
About depth contours
No, and you should never navigate by it. It is survey derived and intended for reading structure and planning where to fish. Use official charts and your own sounder for navigation.
No. Depth contours are free, and so is every other layer today, Strike Zones included.
Coverage follows the underlying NOAA surveys, which are strongest on coastal and Great Lakes water. Many inland systems are covered through CRM, and coverage expands as the pipeline ingests more survey tiles.
Tomorrow morning starts tonight
Set your home water, pick a drive radius, and wake up to a plan.
Android coming soon
iPhone, iOS 17 or later. Setup takes about a minute.